Introduction
One can’t afford to ignore Expected Goals (xG) now that Match of the Day are giving the metric such a huge profile.
I’m not a massive fan of xG, but I thought it was worth further investigation and so, thanks to data from StrataData ((www.stratagem.co), I have been doing some work on it.
Naturally, I have read the work published by the many experts on the subject, such as M Caley of @MC_of_A, and @11tegen11. I have also looked at https://jameswgrayson.wordpress.com/ but his useful contribution on the subject is historic, and because it stopped years ago, I feel it is unlikely to be of value in today’s data rich environment. One thing I noticed is that while many analysts praise the predictive powers of xG nobody provides any concrete proof of this important aspect of this metric. Take for example 11tegen11:
“On 11tegen11, we’ve made the case for expected goals……. being the single best predictor for future match outcomes, better than points, goals, shots or shots on target” (1)
Yes, but then he goes on to elaborate some theoretical proof of this statement, using Poisson distribution and Monte Carlo method.
As a data miner, I don’t have much time for that. What I was expecting (at least) was some sort of summary table that compared actual match results with those predicted by his model, and some statistical analysis of these results that supported his claim. Perhaps he did that in some of his later blogs, but I couldn’t find any. I have also looked for others, but all I could find were summary tables that compared overall actual game results with predicted xG. Perhaps I am not being very thorough in my search, so I am ready to change my mind if you can show me some evidence to the contrary.
First attempt at prediction
So for my first contribution to the xG debate, I have investigated its predictive powers. For me, this means computing the historic xG of two teams in a forthcoming game and predicting that the team with the higher one will win, and if similar the game will be drawn. I published the first results in my twitter account (@soccerlogic) last weekend, as in the table below, and (hopefully) will do so for the weeks ahead, until the end of the season.
Table 1. xG prediction


Each week I will also aim to publish a summary table of predicted vs. actual results to give an account of how good these predictions were.
This is, of course, just one aspect of my work on xG, which, given the small sample of games involved, to the end of the season, won’t be sufficient to say much about the predictive powers of xG. So I intend to follow (in parallel) this initial effort, by doing a similar work on historic data and publishing the results here on my blog.
Some explanation of how Team xG results were computed
- Data: – shot data from the EPL; seasons 2016-17 plus 2017-18 (March 5) – just over 14,000 shots. Train data: 2016-2018 (Feb 12) | Test data: Feb 13 – March 12 match data (20 matches – 48 goals). No penalties and Dangerous
- Model:- binary classification with binary DV [0,1] (no-goal, goal)
- Attributes (Ind. Vars):- shotLoc_X, shotLoc_Y, bodyPart, shotQuality, assistLoc_x, assisLoc_y, assistType
- Notes:- No penalty data | Dangerous Moments (Chances) also left out of Goal count ( but included in no-goal).
Model building process
- Use Decision Tree to find significant attributes in Train data
- Use significant attributes to create a number of NN (Neural Network) models
- Validate models using Test data (details above)
- Select most accurate model using a combined % accuracy + goals predicted.
- Best model has 88.5% validation accuracy and predicts 29/48 = 60% goals)
- Best model used to ‘score’ (compute probabilities of all shots) Train data
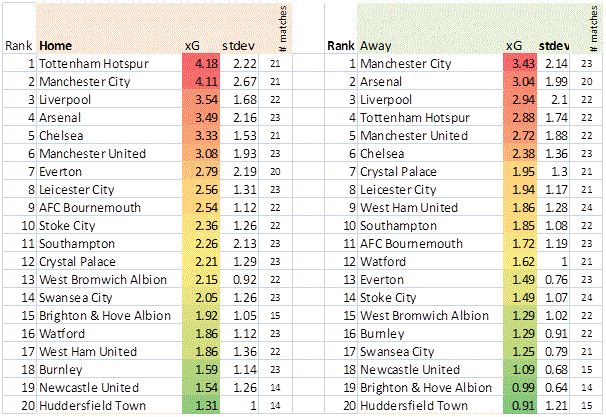
- Compute team xG (home and away) = avg xG of All matches played (Home, Away)
- Results (historic team xG) are shown in the table below
Table 2. Team xG (2016-17-18 (March 5)
Additional information on model selection, analysis, results
- Only some of the attributes (variables) in the data were used in the model. Some were left out because of their fractional contribution to accuracy, others because considered to be subjective (e.g. chanceRating). Of the latter, only shotQuality was included because of its significant impact on accuracy. This attribute acts basically a proxy for Opta’s gmlocy, gmlocz which basically indicate the goal-direction of a shot, are highly significant in determining xG.
- Last but not least, shot location does not appear to be “By far the most important predictor.” as 11tegen11 claims, however defined. And definitely not ‘by far’. ShotQuality (as gmlocy, gmlocz do) affect xG equally if not more than location’ – as one can shoot from a ‘good’ location, but if the shot is directed to the keeper, it has a high probability of being saved.
- Various classification techniques (Log R, SMO, Naive Bays, Random Forest, etc.) available in Weka 3.8 were also used to build and validate the model; while some achieved similar accuracy to NN, their goal prediction was far lower (looking for someone to volunteer an explanation for that).
Future work
In later work on this I’ll add data from the Championship, and possibly the MLS. One objective is to verify whether more data does make any difference to the accuracy of the model. Soon I will also publish data on players’ xG.
(1) http://11tegen11.net/2015/08/14/a-close-look-at-my-new-expected-goals-model/