- Introduction
With the 2017 MLS season approaching, I am going to take a look at last year (2016-17 season) results and in particular at the attacking effectiveness of Teams and Players. One way to measure this is to compute the percentage (%) of Shots that are converted into Goals, which I shall call SG%.
The purpose of this analysis is to classify Teams and Players with respect to this metric, and thus provide a series graphics and tables to show the results. The analysis is performed using a clustering algorithm that splits Teams into clusters, such that those in each cluster have similar SG%, and are significantly different form than to those in other cluster. Players are clustered in the same way..
The easiest and (probably) best way to cluster with respect to a binary variable (goals vs. shots) is to use the algorithm known as classification by decision tree induction (DT). As well as providing great flexibility, this has the advantage to display the results in easy-to-understand graphics. The tool used to for the analysis is a professional software that creates DTs using the CHAID technique. This is named from the CHI-square test used to validate the statistical significance of the results (diversity between clusters).
This DT method and, in particular, its sophisticated implementation in this software makes it easy to compute not only the overall performance of Teams and Players, but also to perform a conditional analysis of their SG% metric. That is to compute the SG% for all particular conditions/contexts reported in the data, such as Patterns of play (Regular, Fast-break, Set-piece, etc. ), Assisted vs. Solo , Cross vs. Other shots, etc.
Details of the results of this analysis follow. First we show the graphic tree with the clusters (tree nodes) created by the algorithm and the Teams or Players belonging to them. The cluster with with the highest SG% is tagged, and details of the Teams or Players shot profile are given in the table together with their individual SG%.
- Team analysis
Graph 2.1 Team shooting effectiveness – All plays
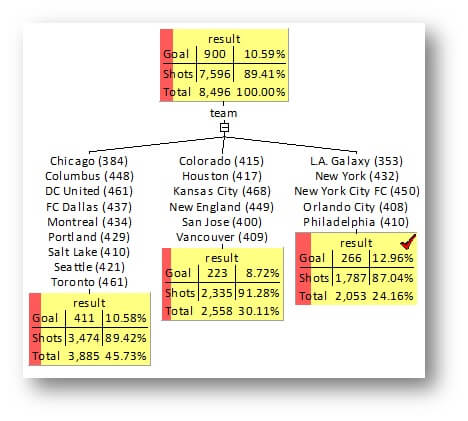
Legend: Of a total 8,496 shots only 900 were converted into goals (10.59%), as shown in top node. Teams are split (automatically by the algorithm) into three clusters. The one tagged has the best SG% at 12.96%, and contain the five teams with the highest SG%.
Graph 2.2 Top shooters from Crosses
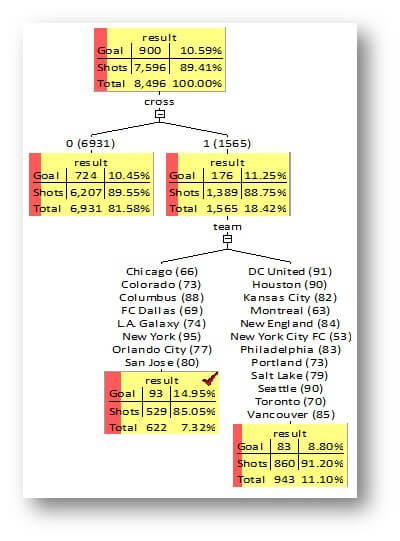
Legend: Teams do slightly better with converting Crosses to Goals, than from other type of passes: 11.25% vs. 10.45% (difference not significant). However some teams do significantly better than other in scoring from Crosses, 14.95% vs. 8.80%.
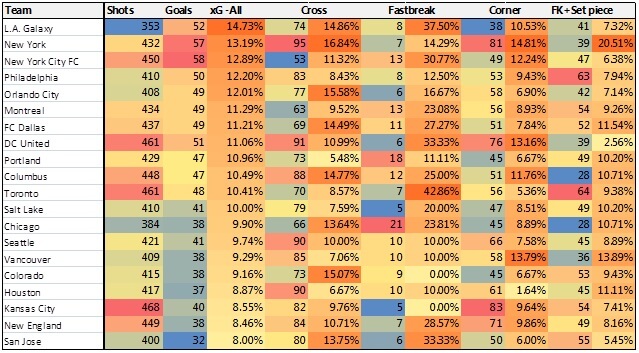
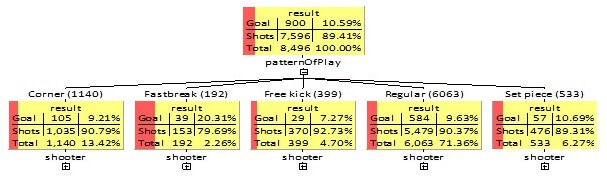
Graph 2.3 Top shooters by Pattern of play
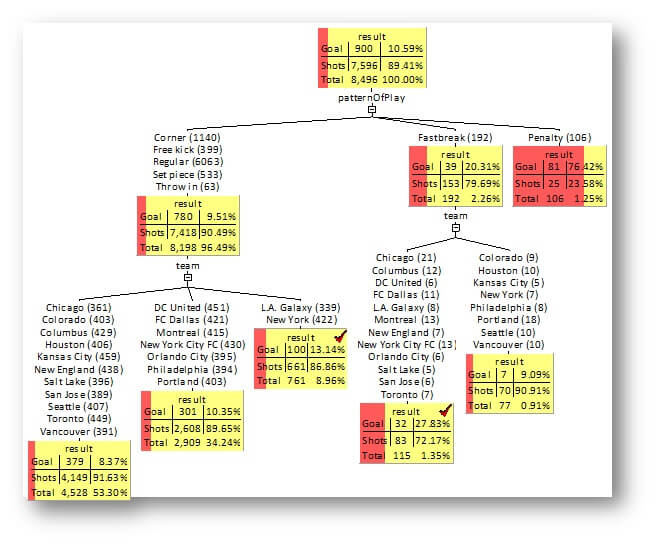
Legend: Only shooting from Fast-breaks (Fb) is significantly more effective than other types. In fact, scoring from Fast-breaks is more than twice as likely (21.31%) than from any other play ( 9.51%). There is also a wide difference between teams in scoring from Fb, and they split into two clusters with SG% of 27.83% and 9.09% respectively. For other plays (Corner, Fk, etc.), the performance gap among Teams is narrower, with LA Galaxy and NY topping the list, at 13.14%. Performances are of all plays are summarised in the table below.
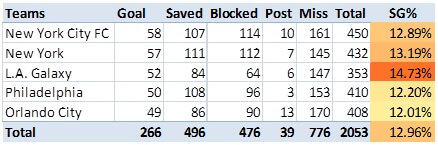
Table 2.2 Summary of Team shooting performance by play
- Player analysis
Graph 3.1 Best shooters
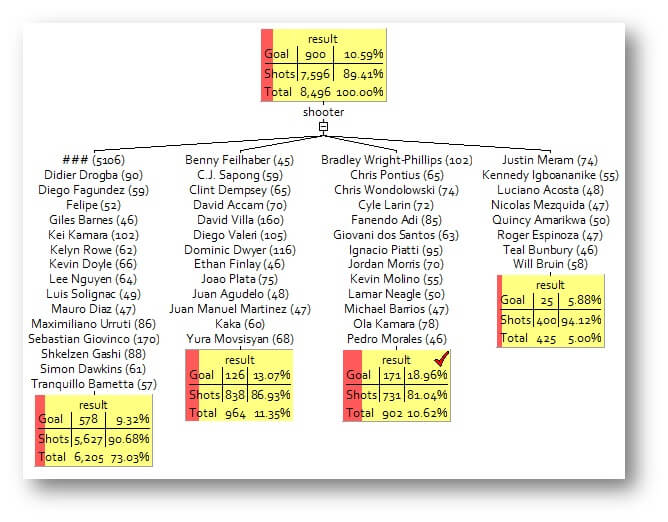
Legend: Best shooters are players that convert more shots into goals (i.e. have higher SG%). The algorithm splits them into four clusters, with the best averaging a 18.96% success rate.
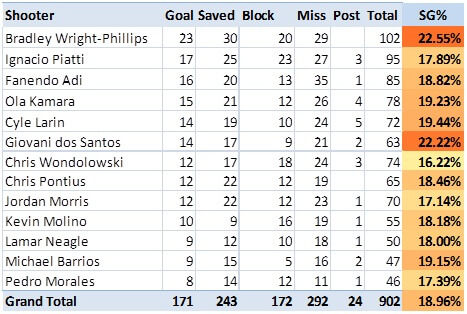
Table 3.1 Effectiveness (SG%) of top shooters
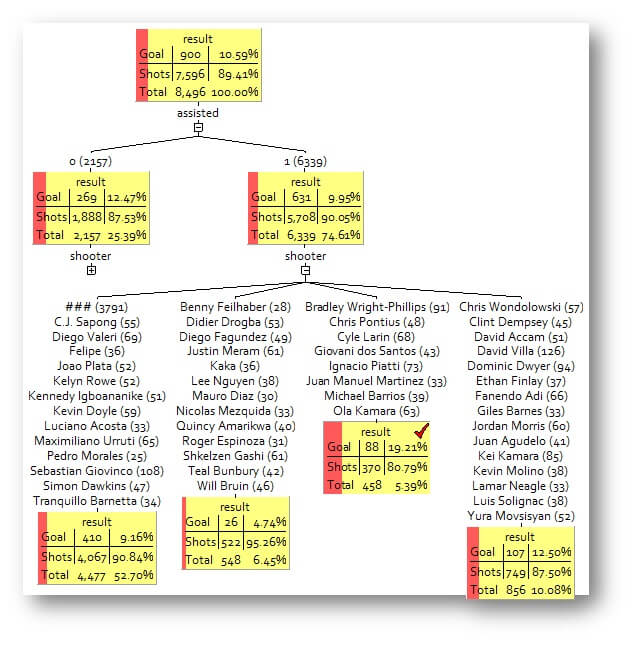
Graph 3.2 Shots from cross
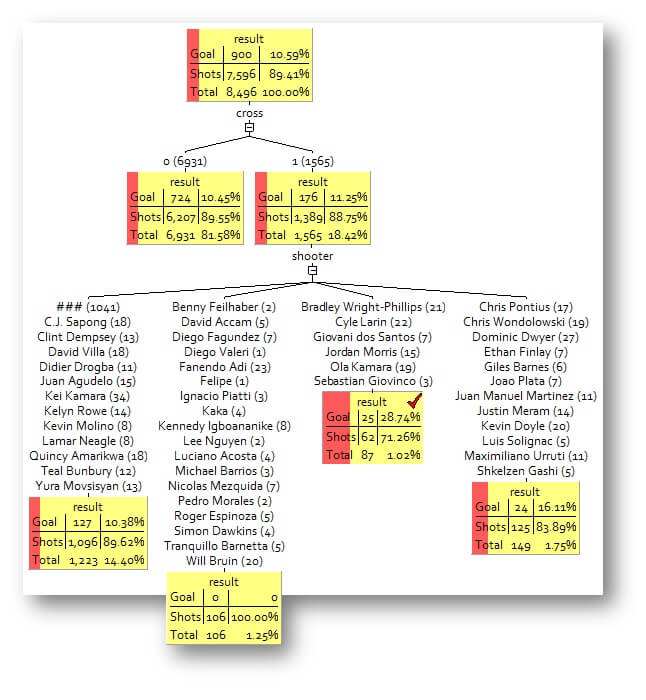 Legend: The success rate (SG%) from Crosses (1) is 11.25%, and 10.45% from other shots(0). This is not significantly different and the split has been forced manually to focus on Cross. Players divide into four clusters, with a wide margin between the top rated shooters (28.74%) and the others.
Table 3.2 Top goal-scorers from Crosses
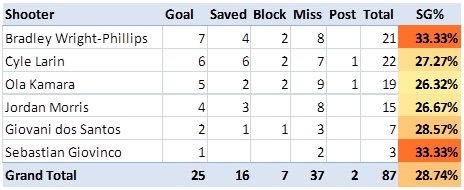
Graph 3.3 Assisted (1) vs. Individual play (0)
Legend: Player are divided into four cluster, with the best ones (in tagged node) averaging an 19,21 SG%, and separated by a wide margin by the second best (12.5%).
Table 3.3 Best shooters from Assists

Graph 3.4 Top Assist providers (passers)
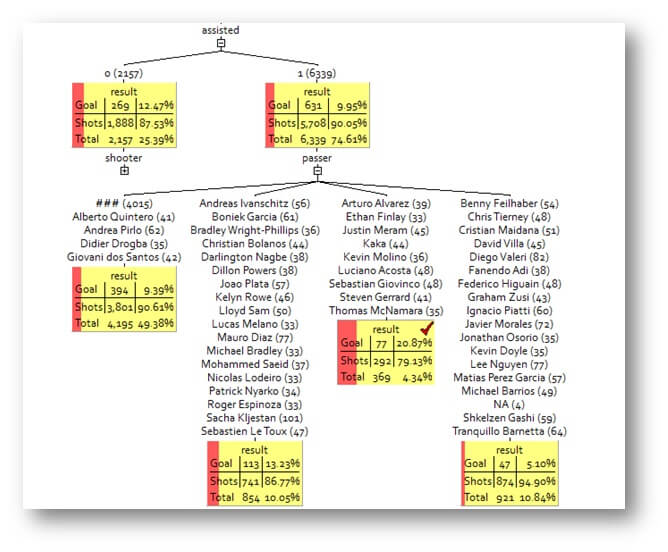
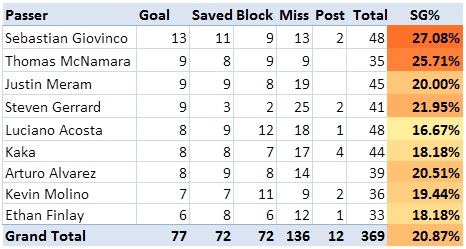
Legend: Leading assist providers also are also split in four cluster, with TFC’s Giovinco topping the cluster (tagged) of best ones with a 27.08% SG%.
Table 3.4 Top Assists providers
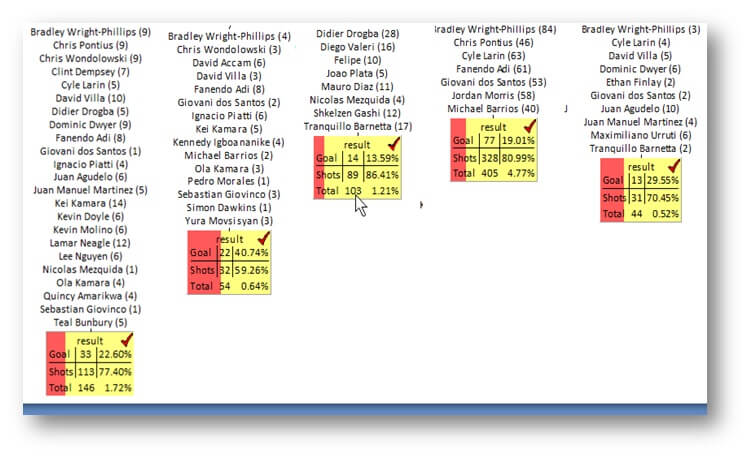
Legend: The graph above has been created by combining the clusters with the highest SG% for each pattern-of-play. While Bradley WP is listed first in four of them, this is not because he has the highest SG% (although he may well have), but because players in a cluster are shown (by the software) in a alphabetical order, and not by highest to lowest SG%.
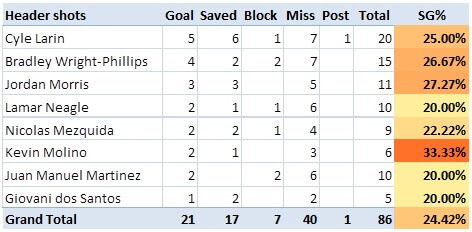
Graph 3.6 Best headers (Head > Goal)
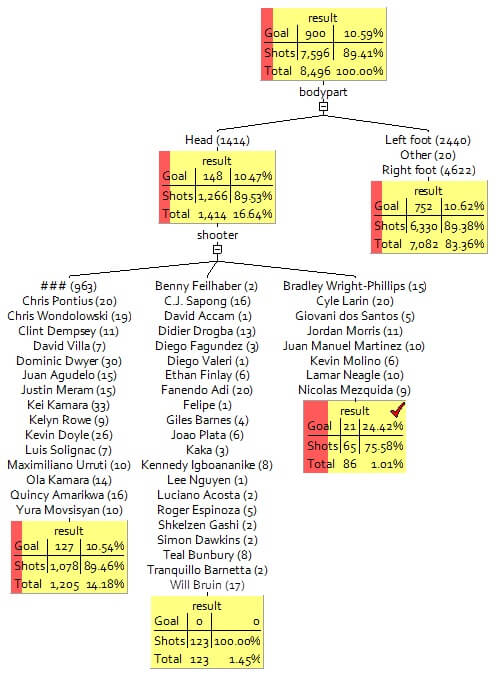
Legend: SG% of Headers (10.47%) is not significantly different from other attempts (10.62%) – the first split has been forced in order to analyse Headers separately.
Table 3.6 Best headers
Disclaimer: I am aware that the data used in this analysis (collected from WhoScored) does not correspond 100% to the official data. I am confident, however, that any differences from official results are likely to be relatively minor, and such as to make little difference to the accuracy of the results.