Recently I spent some time deciphering the MCFC Analytics advanced dataset. As you know this comes from Opta in XML format and, for those of us used to analyse data in tabular format, needs ‘translating’. I won’t explain how I did it, but I now have an Excel file with details of the main events and their associated players and positions.
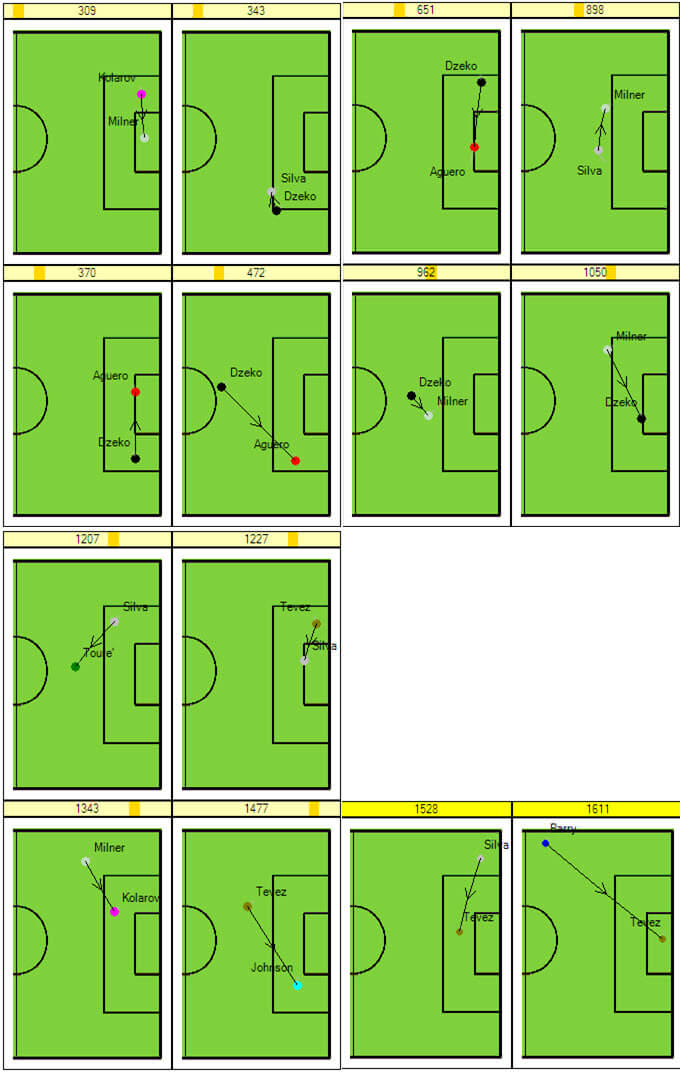
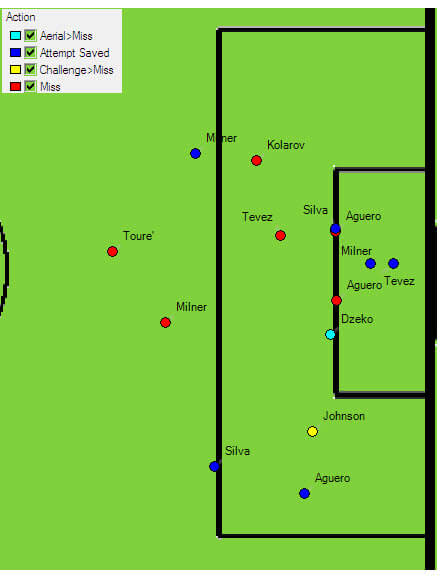
After playing around with the data, I developed the following visualizations graphics that map City’s key passes and attempts. These events are linked, as an attempt always follows a key pass.
The visualisations need no explanation, illustrating where the passes that leads to attempts came from.
Key passes
Attempts
“Beware the left-wing”, that should be the warning that managers of teams playing Manchester City should be giving to their players
The visualisations clearly show City’s preference for attacking from the left half of the pitch. With only three of Manchester City’s 14 shots coming from the right, Bolton’s defenders in that part of the pitch must have enjoyed a quiet afternoon.
So the message to teams playing Manchester City is clear – seek to neutralise the Champion’s attacks down the left side of the pitch.”


